

- Second quarter operating revenues of $5.5 billion, increased 2% year over year
- Operating income of $466 million, decreased $336 million year over year
- Adjusted EBITDA* of $914 million, decreased $306 million year over year
- Leverage ratio* of 1.0 as at June 30, 2024, compared to 1.1 at end of 2023
MONTREAL, Aug. 7, 2024 /CNW/ – Air Canada today reported its second quarter 2024 financial results.
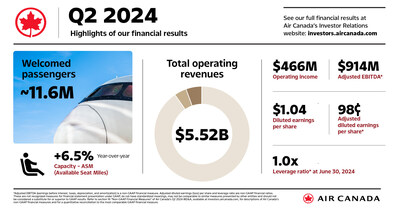
“Air Canada today reported second quarter operating revenues of more than $5.5 billion and adjusted EBITDA of $914 million. We saw healthy demand, with load factors remaining above historical averages. We remained sharply focused on our customers and operations throughout the quarter and experienced a 10-percentage point year-over-year improvement in our on-time performance, even with the increased flying. I thank our employees for their hard work in safely transporting 11.6 million customers in the quarter and I am pleased to see their efforts recognized as we were ranked the best airline in Canada and received five honours at the Skytrax 2024 World Airline Awards, the most of any Canadian carrier,” said Michael Rousseau, President and Chief Executive Officer of Air Canada.
“When compared to the second quarter of 2023, we increased our capacity 6.5 per cent in the period. Our adjusted unit cost was well contained, increasing 1.7 per cent. This was supported through rigorous cost discipline, which is always a top priority for us. We will continue to adapt to market conditions, manage capacity proactively and contain costs through productivity and other initiatives.
We further diversified our network, including with services to Singapore, Stockholm and India, and enhanced our operational flexibility by securing an additional eight Boeing 737-8 aircraft, set to enter service next year. These actions reaffirm our dedication to our customers, whom I thank for their continued loyalty. We are proud of our role as Canada’s leading global airline, connecting Canada to the world.”
Second Quarter 2024 Financial Results
The following is an overview of Air Canada’s results of operations and financial position for the second quarter 2024 compared to the second quarter 2023.
- Operating revenues of $5.519 billion increased $92 million or 2% on 6.5% more operated capacity. The year-over-year capacity increase was in line the projection provided in Air Canada’s May 2, 2024, news release.
- Operating expenses of $5.053 billion increased $428 million or 9%.
- Operating income of $466 million, with an operating margin of 8.4%, decreased $336 million.
- Adjusted EBITDA of $914 million, with an adjusted EBITDA margin of 16.6%, declined $306 million.
- Net income of $410 million or $1.04 diluted earnings per share, compared to $838 million or $2.34 respectively.
- Adjusted net income of $369 million or $0.98 adjusted earnings per diluted share, compared to $664 million or $1.85 respectively.
- Adjusted CASM of 13.53 cents increased 1.7% year-over-year, driven by labour, maintenance and information technology expenses increasing at a higher rate than capacity.
- Net cash flows from operating activities of $924 million, decreased $566 million.
- Free cash flow* of $451 million, decreased $514 million.
- Net debt-to-adjusted EBITDA ratio was 1.0 at June 30, 2024, compared to 1.1 at December 31, 2023.
Outlook
For the third quarter of 2024, Air Canada plans to increase its ASM capacity between 4% and 4.5% from the same quarter in 2023.
For the full year 2024, Air Canada is confirming the following guidance, which was updated on July 22, 2024:
| Metric | 2024 Guidance |
| ASM capacity | 5.5 to 6.5% increase versus 2023 |
| Adjusted CASM | 2.5 to 3.5% increase versus 2023 |
| Adjusted EBITDA | $3.1 to $3.4 billion |
Major Assumptions
Air Canada made assumptions in providing its guidance—including moderate Canadian GDP growth for 2024. Air Canada also assumes that the Canadian dollar will trade, on average, at C$1.36 per U.S. dollar for the full year 2024 and that the price of jet fuel will average C$1.03 per litre for the full year 2024.
Selected Financial Metrics and Statistics
The financial and operating highlights for Air Canada for the periods indicated are as follows:
| (Canadian dollars in millions, except per share data or where indicated) | Second Quarter | First Six Months | ||||
| Financial Performance Metrics | 2024 | 2023 | $ Change | 2024 | 2023 | $ Change |
| Operating revenues | 5,519 | 5,427 | 92 | 10,745 | 10,314 | 431 |
| Operating income | 466 | 802 | (336) | 477 | 785 | (308) |
| Operating margin (%) | 8.4 | 14.8 | (6.4) pp | 4.4 | 7.6 | (3.2) pp |
| Adjusted EBITDA | 914 | 1,220 | (306) | 1,367 | 1,631 | (264) |
| Adjusted EBITDA margin (%) | 16.6 | 22.5 | (5.9) pp | 12.7 | 15.8 | (3.1) pp |
| Income before income taxes | 404 | 796 | (392) | 339 | 773 | (434) |
| Net income | 410 | 838 | (428) | 329 | 842 | (513) |
| Adjusted pre-tax income | 371 | 656 | (285) | 277 | 462 | (185) |
| Adjusted net income | 369 | 664 | (295) | 273 | 476 | (203) |
| Total liquidity | 10,203 | 10,551 | (348) | 10,203 | 10,551 | (348) |
| Net cash flows from operating activities | 924 | 1,490 | (566) | 2,516 | 2,927 | (411) |
| Free cash flow | 451 | 965 | (514) | 1,507 | 1,952 | (445) |
| Net debt | 3,608 | 5,330 | (1,722) | 3,608 | 5,330 | (1,722) |
| Diluted earnings per share | 1.04 | 2.34 | (1.30) | 0.87 | 2.35 | (1.48) |
| Adjusted earnings per share – diluted | 0.98 | 1.85 | (0.87) | 0.73 | 1.33 | (0.60) |
| Operating Statistics | 2024 | 2023 | Change % | 2024 | 2023 | Change % |
| Revenue passenger miles (RPMs) (millions) | 22,449 | 21,617 | 3.8 | 42,969 | 40,195 | 6.9 |
| Available seat miles (ASMs) (millions) | 26,203 | 24,606 | 6.5 | 50,540 | 46,513 | 8.7 |
| Passenger load factor % | 85.7 % | 87.9 % | (2.2) pp | 85.0 % | 86.4 % | (1.4) pp |
| Passenger revenue per RPM (Yield) (cents) | 22.2 | 22.7 | (2.0) | 22.0 | 22.4 | (2.0) |
| Passenger revenue per ASM (PRASM) (cents) | 19.0 | 19.9 | (4.4) | 18.7 | 19.3 | (3.4) |
| Operating revenue per ASM (TRASM) (cents) | 21.1 | 22.1 | (4.5) | 21.3 | 22.2 | (4.1) |
| Operating expense per ASM (CASM) (cents) | 19.3 | 18.8 | 2.6 | 20.3 | 20.5 | (0.8) |
| Adjusted CASM (cents) | 13.5 | 13.3 | 1.7 | 14.1 | 13.9 | 1.8 |
| Average number of full-time-equivalent (FTE) employees (thousands) | 37.2 | 35.9 | 3.5 | 37.1 | 35.2 | 5.3 |
| Aircraft in operating fleet at period-end | 356 | 354 | 0.6 | 356 | 354 | 0.6 |
| Seats dispatched (thousands) | 14,213 | 13,390 | 6.1 | 27,692 | 25,683 | 7.8 |
| Aircraft frequencies (thousands) | 97.9 | 93.5 | 4.7 | 188.9 | 178.7 | 5.7 |
| Average stage length (miles) | 1,844 | 1,838 | 0.3 | 1,825 | 1,811 | 0.8 |
| Fuel cost per litre (cents) | 104.3 | 101.1 | 3.2 | 104.9 | 114.2 | (8.2) |
| Fuel litres (thousands) | 1,273,467 | 1,162,714 | 9.5 | 2,458,185 | 2,229,799 | 10.2 |
| Revenue passengers carried (thousands) | 11,588 | 11,287 | 2.7 | 22,339 | 21,256 | 5.1 |